
Shopify Real User Monitoring: Setup, Tools and Alerts
Learn Shopify real user monitoring for Core Web Vitals: compare tools, set p75 release gates, segment templates and wire alerts to your team.

Published
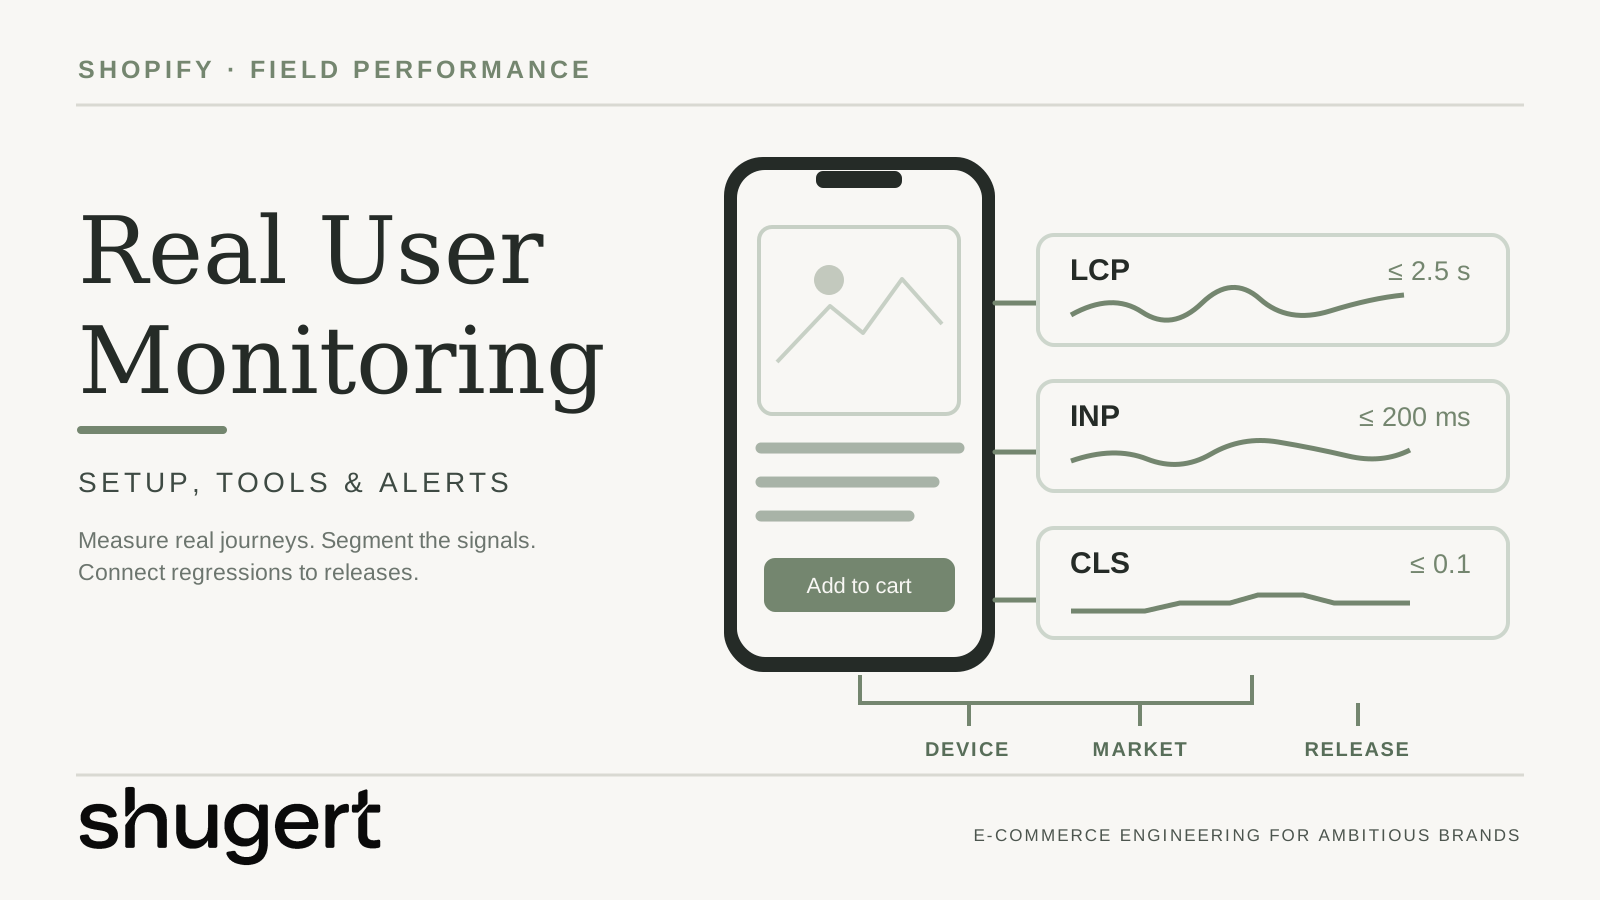
The most repeated advice about Shopify performance is to chase a passing Core Web Vitals score and treat the green label as a finished job. It isn't. A passing field score summarizes qualifying page views over a reporting window; that aggregation can hide regressions on individual templates, devices and shopper journeys. The template that fails on mid-range Android in one market, the cart drawer that stalls on interaction, and the Safari traffic that never reaches the dataset all disappear inside a storewide number.
Getting Shopify real user monitoring right means treating the built-in dashboard as a baseline rather than a verdict, then adding the instrumentation, segmentation and release annotations that make a regression attributable. That work has three parts: choose the right instruments, segment until the slow journeys surface, then wire the findings to alerts and pull requests so they change what ships.
Table of Contents
- Choosing Between Real User and Synthetic Tools
- Core Web Vitals Thresholds to Set as Release Gates
- Instrumenting Custom RUM for Variant and Cart Interactions
- Segments That Reveal Slow Shopper Journeys
- How to Set Up Baseline Monitoring Before a Release
- Coverage Gaps Your Dashboard Will Not Show
- Connecting RUM to Alerts, Dashboards and Pull Requests
- Choose Your Monitoring Stack and Start This Week
Choosing Between Real User and Synthetic Tools
Every monitoring instrument answers a different question, and buying the wrong one is how teams end up with two dashboards and no answers.
Monitoring tools compared by data type and use
| Tool | Data type | Best use | Main limit |
|---|---|---|---|
| Shopify Web Performance Dashboard | Field, eligible Chrome visitors | Baseline by URL, page type, device and region | 30-day summary; reports can lag up to 36 hours, with up to 90 days of available history |
| Chrome UX Report (CrUX) | Field, eligible Chrome users | Public benchmarks by origin and eligible individual URL | URL-level data requires sufficient samples; no Shopify template or release attribution |
| web-vitals JavaScript library | Field, your own beacons | Segmenting by release, route, country and variant state | You build storage, sampling and dashboards |
| SpeedCurve RUM | Field, managed | Performance budgets, dashboards and alerts | Cost depends on plan; confirm with vendor |
| Datadog RUM | Field, with session and error context | Linking slow interactions to JavaScript errors and traces | Cost scales with session volume; model before rollout |
| Lighthouse CI | Synthetic, controlled device and network | Blocking regressions in pull requests | Cannot see interaction delays in real sessions |
| Scheduled synthetic checks | Synthetic, scripted | Uptime and checkout path tests | Single device profile misses real device mix |
Shopify's Web Performance Dashboard is the free field layer. It arrived in January 2024 as a shift from synthetic speed scoring toward real user measurement, reporting Largest Contentful Paint (LCP) for loading, Interaction to Next Paint (INP) for responsiveness and Cumulative Layout Shift (CLS) for visual stability, each at the 75th percentile so a passing page is one where roughly three quarters of measured experiences cleared the good threshold. Its value is that it captures what a lab cannot: device, browser, connection and geography differences across live traffic, tied back to theme updates, app installs and code changes.
CrUX is a public benchmark at origin level and, for eligible pages with sufficient samples, at individual URL level. It does not include Shopify theme versions, app deployments or variant state, so it cannot attribute a regression to a release from last Tuesday. Google's CrUX API documentation describes both reporting levels. The web-vitals JavaScript library is the build option, tagging beacons with release, route, country and variant state while leaving storage, sampling and dashboards to your team. Managed RUM removes that maintenance: SpeedCurve organizes budgets, dashboards and alerts, while Datadog connects slow interactions to JavaScript errors and session traces. Confirm current pricing with each vendor, because managed costs scale with session volume.
Synthetic tools answer the lab question. Lighthouse CI runs a controlled device and network profile on every pull request and blocks regressions before merge, which is the cheapest defect you will ever fix. It cannot see an interaction that stalls ninety seconds into a real session. Scheduled synthetic checks cover uptime and a scripted checkout path, but they exercise one device profile and one network shape.
A store with custom variant logic, subscription widgets and a B2B price list needs both halves: field data to show where shoppers suffer, synthetics to reproduce and fix. The default stack worth starting from is the Shopify dashboard as the free baseline, Lighthouse CI on pull requests, and one managed RUM tool or a custom web-vitals pipeline for production alerting. The build-or-buy rule is simple. Buy when you need alerts inside one sprint. Build when you need dimensions no vendor models, such as variant selector state or cart drawer render time, and you have engineers to own a pipeline. The cost trade is rarely intuitive: a subscription becomes engineering hours for storage, sampling, dashboarding and upkeep, so model both. The lab-versus-field distinction behind these choices is unpacked further in Shopify Lighthouse versus Core Web Vitals.
Core Web Vitals Thresholds to Set as Release Gates
A release can meet Shopify's performance bands while a key shopper journey gets slower. Set thresholds per conversion-critical template and device class, then use segment data to choose what to fix.
Core Web Vitals thresholds at the 75th percentile
| Metric | Good | Needs improvement | Poor |
|---|---|---|---|
| LCP | 2.5 seconds or less | Above 2.5 to 4 seconds | Above 4 seconds |
| INP | 200 milliseconds or less | Above 200 to 500 milliseconds | Above 500 milliseconds |
| CLS | 0.1 or less | Above 0.1 to 0.25 | Above 0.25 |
The Shopify Web Performance ShopifyQL schema defines these bands and provides percentile metrics with dimensions such as browser family, page type and device. Gate on p75 rather than an average, which can conceal a worsening slow tail.
Sitewide pass rates can conceal problems on specific templates or devices. Shopify's theme performance data table reports a median of 97.8 percent of shops passing LCP, 96.3 percent passing CLS and 97.3 percent passing INP, while 91.5 percent pass all three simultaneously. Across the full dataset, the combined range runs from 33.1 percent to 98.0 percent of shops. A healthy theme-level result can mask regressions from app scripts, custom sections or market-specific experiences.
Set release gates for conversion-critical templates such as homepage, collection, product and cart, with separate rules for each device class. Then compare each release against that template's own baseline.
Operational rule: when mobile product-page p75 INP exceeds 200 milliseconds across an adequately sampled field window, investigate and consider pausing further rollout. A regression of more than 10 percent against the template baseline should trigger review; that percentage is our example internal policy, not an official Google or Shopify threshold. Field data arrives with delay, so block pre-merge regressions using synthetic Lighthouse CI budgets rather than treating monthly p75 as an immediate pull-request gate.
Use field thresholds to prioritize post-release investigation and rollout decisions; use segment data to choose what to fix. For example, a variant selector may shift the product page after a review widget loads late. Heavy app scripts can also delay interactions across templates, while oversized hero images can push LCP higher. For practical remediation, use our Shopify app-bloat diagnostics before removing functionality. Check which template, device and release show the regression before changing the theme or removing an app. For remediation tactics, consult Shopify's web performance documentation. Our Shopify Core Web Vitals optimization guide covers template-level improvements, while production-theme LCP debugging helps diagnose loading regressions.
Instrumenting Custom RUM for Variant and Cart Interactions
Shopify's field reports provide breakdowns by page URL and page type, alongside device and geographic dimensions. They do not expose custom variant state, the precise interaction target or a release identifier, so a custom pipeline has to carry those dimensions. Shopify documents the available breakdowns in its web performance reports.
A workable payload records a random visit identifier, the release version, the route template rather than the full URL, device class, coarse region and sampling rate, with LCP, INP and CLS collected through the web-vitals library and its attribution build so each INP entry arrives with the interaction target and long-task timing. Send it with a background beacon when the page becomes hidden. On Hydrogen or any client-side navigation storefront, track route changes and back-forward-cache restores explicitly, because one page load does not equal one experience.
Privacy belongs in the design, not in a later review. Use route templates, strip query strings and customer identifiers, keep a short-lived session ID, discard IP addresses once coarse geolocation is derived, and apply consent rules identically across every beacon. The RUM instrumentation design guide frames the operational side well: weight sampled observations back to traffic volume, suppress segments below a session floor, and store release metadata alongside each event. The most common failure is volume without structure, a mountain of timings with no stable dimensions, which leaves nobody able to say whether a regression came from theme code, an app embed or one market. For the interaction-level debugging that follows, the INP debugging walkthrough on event handlers covers the trace work.
Segments That Reveal Slow Shopper Journeys
Say a store's storewide mobile LCP sits comfortably under the good threshold and the team concludes mobile is fine. Segment by template and the picture changes: product pages with a five-option variant selector and a live inventory widget report INP above the good band, while collection pages pass cleanly. The storewide figure averaged a healthy template and an expensive one, and now the fix has an address.
The core dimensions to cut first are page template, device category, country, browser, connection quality and traffic source. For Shopify Plus catalogs, add the segments that reflect how the store sells: products with complex variant selectors, collections with extensive faceted filtering, and any page carrying third-party widgets for reviews, subscriptions or personalization. Those are the places where a template that benchmarks well falls apart under real interaction.
Interaction type is the second cut. Pairing INP segments with the element or action involved separates a slow variant swap from a slow add-to-cart from a slow cart drawer update. Those three have different owners in the codebase and different fixes, and a blended INP number points at none of them. Variant state and interaction tags have to come from the instrumentation setup described earlier, so that work ships before segment review starts.
A segment with 40 sessions in a month isn't a finding. It's a rumor with a percentile attached.
Before acting on any segment, check the sample size. Low-traffic markets, rare device classes and short release windows all produce noisy percentiles, and the discipline is to flag those segments as insufficient rather than treating them as evidence. A country-level p75 built on a few dozen sessions will swing hard enough to send engineers in the wrong direction for a week. For the full audit structure that pairs segment analysis with theme and app review, see the Shopify performance audit framework.
Three segments earn a first look on almost every store: the product template on mobile, cart interactions, and the market with the largest order volume. If those three are clean at the 75th percentile with adequate sample sizes, the next candidates are the collection template on mobile and any market running distinct payment or shipping logic.
How to Set Up Baseline Monitoring Before a Release
A baseline is the only thing that turns a future regression into a fact instead of an argument. Run these steps in order, and treat the common slip beside each one as the reason the step exists.
-
Capture a baseline over a window your traffic supports, ideally 28 days so a full weekly cycle is included. Shopify's metric summary uses real-user data from the previous 30 days, per the Shopify Help Center web performance reports guide, so read that as the reference window. The slip is expecting same-day movement from a monthly aggregate.
-
Choose representative URLs: the homepage, one high-traffic collection, the top five product pages by revenue, and the cart. The slip is monitoring only the homepage and calling it storefront coverage.
-
Segment each URL by device category and country, then record p75 LCP, INP and CLS with the sample size beside every value. The slip is reading the aggregate and missing the weak mobile segment entirely.
-
Annotate every theme release, app install, app embed change and script update with date, version and owner. The slip is shipping changes unannotated, which leaves the next regression impossible to attribute.
-
Set field-alert thresholds per conversion-critical template and use separate synthetic performance budgets in CI to catch pre-merge regressions. Field reports are delayed and need enough samples for a post-release decision. The slip is treating one sitewide monthly p75 as an immediate pull-request gate.
-
Deploy in a low-traffic window and compare the same segments afterward, once the release has stabilized over a comparable weekday mix. The slip is comparing a fresh Lighthouse run against field data and treating the difference as a regression.
-
Save the baseline record: segment, p75 values, sample size, release identifier and owner, in a place the next person can find. The slip is keeping it in a chat thread.
A healthy baseline looks stable across consecutive weeks, with sample sizes above your floor and every change tied to an annotation. When comparing windows, adjust for device mix, traffic source mix and any functional changes during the period, and report p75 movement without claiming conversion effects unless you hold evidence for that link.
Coverage Gaps Your Dashboard Will Not Show
A passing score is not proof the storefront is healthy. Shopify's field data comes from opted-in Chromium visitors and includes only sessions where the page loaded successfully, as the Web Performance overview in the Shopify Help Center describes it. Every shopper outside that population is absent from the number you're about to quote in a board update.
The blind spots are concrete: Safari and Firefox shoppers, privacy-conscious visitors whose analytics are blocked, failed page loads that never became measurable, and markets where Chromium share is thin. Then there's survivorship bias. A store can report acceptable field metrics precisely because its slowest, most failure-prone visits dropped out of the dataset before reporting. B2B and international storefronts carry the most exposure here, since device mix and network quality differ sharply by market.
Run a coverage audit rather than assuming. Compare the dashboard's visit mix against GA4 or server-side analytics by browser and country, list templates with no field data at all, and mark the markets where Chromium coverage is too thin to trust. Reconciliation comes from the sources the dashboard can't see: server error logs, checkout failure rates from store analytics, and scheduled synthetic checks on the checkout path. Where measurement gaps overlap with rendering or crawlability, a Shopify technical SEO audit can distinguish indexation defects from missing field samples.
A Shopify Plus brand with solid Chrome coverage in the United States and heavy Safari usage in its European markets cannot treat a dashboard pass rate as evidence that the European storefront performs.
Checkout deserves its own note. Replacing checkout customizations is an architecture change, and Shopify's checkout technology documentation is explicit that merchants with checkout.liquid customizations must upgrade to checkout extensions to use Function APIs, with checkout UI extensions on the information, shipping and payment steps available only to Plus stores. Inventory that behavior before a migration launch so monitoring covers the new surfaces rather than the old ones.
Connecting RUM to Alerts, Dashboards and Pull Requests
Field data that nobody acts on is a report. The operational layer is small, and it decides whether monitoring changes behavior.
Alert on the rule that survives noise: p75 on a conversion-critical template crossing its threshold for two consecutive days, routed to the engineer who owns that theme or app embed. Single-day alerts fire on traffic mix and get muted within a month.
Alert hygiene: an alert without a named owner is a notification, not a control.
Build four dashboard panels, one each for templates, devices, markets and releases, and show p75 LCP, INP and CLS against threshold with sample size beside every series. Link each release annotation to its pull request so a regression resolves to a specific commit or app version rather than a suspicion. Keep Lighthouse CI as a pre-merge check and read it against field trends, never as proof of production behavior. If a managed tool is in place, SpeedCurve carries budgets and alerting, while Datadog earns its place when a slow interaction needs to be tied to a JavaScript error or session trace.
Each monitored template needs four recorded attributes: owner, threshold, alert channel and review cadence. Product and cart templates warrant a weekly review. Collection and homepage templates are fine monthly.
Choose Your Monitoring Stack and Start This Week
The decision is to pick the stack and capture a baseline this week, before the next theme release or app install makes the current state unrecoverable. The first 14 days can establish instrumentation, alert owners and review cadence; a reliable field baseline may need a representative window of roughly 28 days or longer for low-traffic segments.
In week one, record the Shopify dashboard baseline for each conversion-critical template, choose the segments, and assign one owner per template. In week two, add release annotations, set the first p75 gate for product and cart templates, and route the alert to a named person. If the team wants outside scoping, Shugert takes over existing Shopify stores and most engagements start with an audit of the current theme and apps. Access stays limited to what the work requires: a Shopify staff account, a development theme, GA4, Search Console and session evidence.
One more decision rule, and it's the one that matters. If the team cannot name the owner of each release gate, fix ownership before adding another tool. An unowned threshold is worse than no threshold, because it produces alerts that train people to ignore alerts.
Shugert works with established Shopify and Shopify Plus brands on exactly this problem: separating a lab score from real shopper experience, instrumenting what the built-in dashboard can't see, and tying performance work to specific theme components, app embeds and release gates. If the storefront has outgrown its monitoring, the team can start with a review of the current theme, app stack and field data, then implement and validate the changes against segmented p75 measurements. Visit Shugert to scope that work, explore our Shopify performance optimization services, or request a technical assessment for a scoped implementation.
Keep exploring this topic
Deeper references from the Shugert library and the service that turns this work into a fixed scope.
Related resources
- PerformanceMoving Core Web Vitals on Shopify: LCP, INP & CLS in 2026What actually moves LCP, INP and CLS on a real Shopify store. For the broader speed framework, see our Shopify Performance Optimization Guide.
- PerformanceShopify App Bloat: How Too Many Apps Kill Store PerformanceEvery Shopify app taxes every page load. How to audit your stack, cut the bloat costing you the most LCP and INP, and stop the pattern from repeating.
Related services
Keep reading

Shopify Performance Audit: How to Audit Every Store Template
A Shopify performance audit method for product, collection, search, cart, and homepage bottlenecks using real user data.
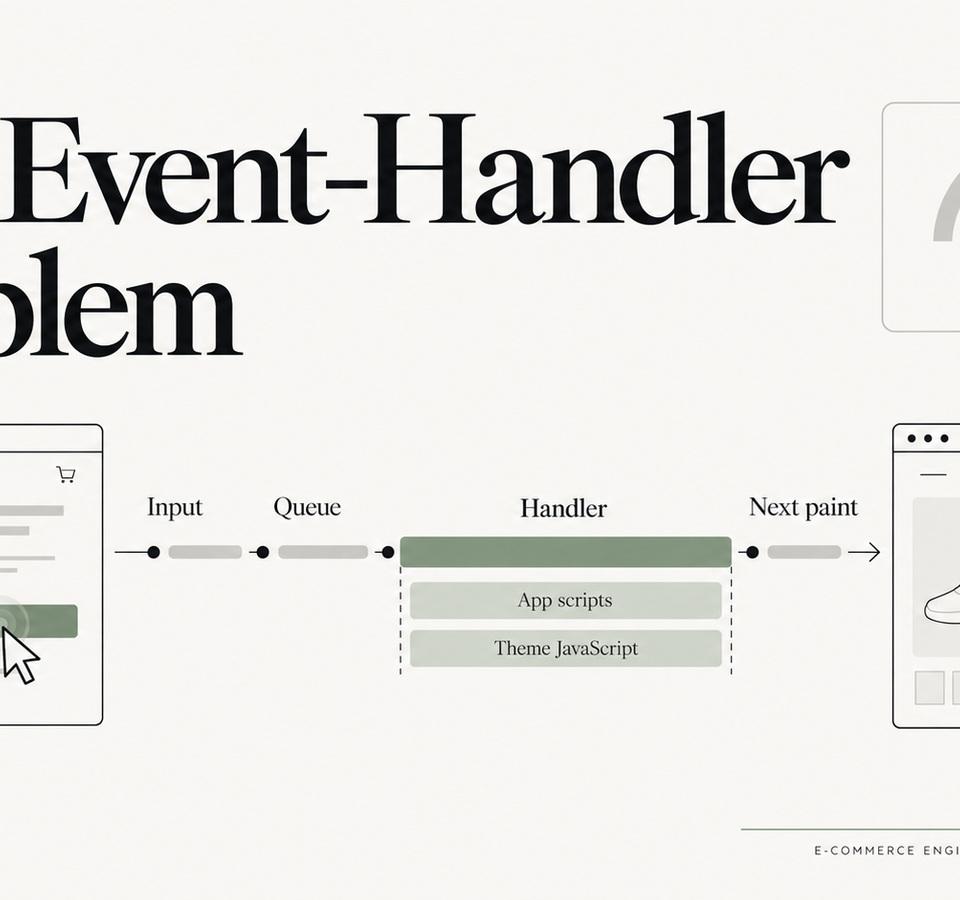
INP on Shopify: The Event-Handler Problems Lighthouse Doesn’t Explain Well
When a Shopify storefront feels sluggish after it has loaded, the problem is often not download size but the work triggered by clicks, taps, typing and DOM updates.
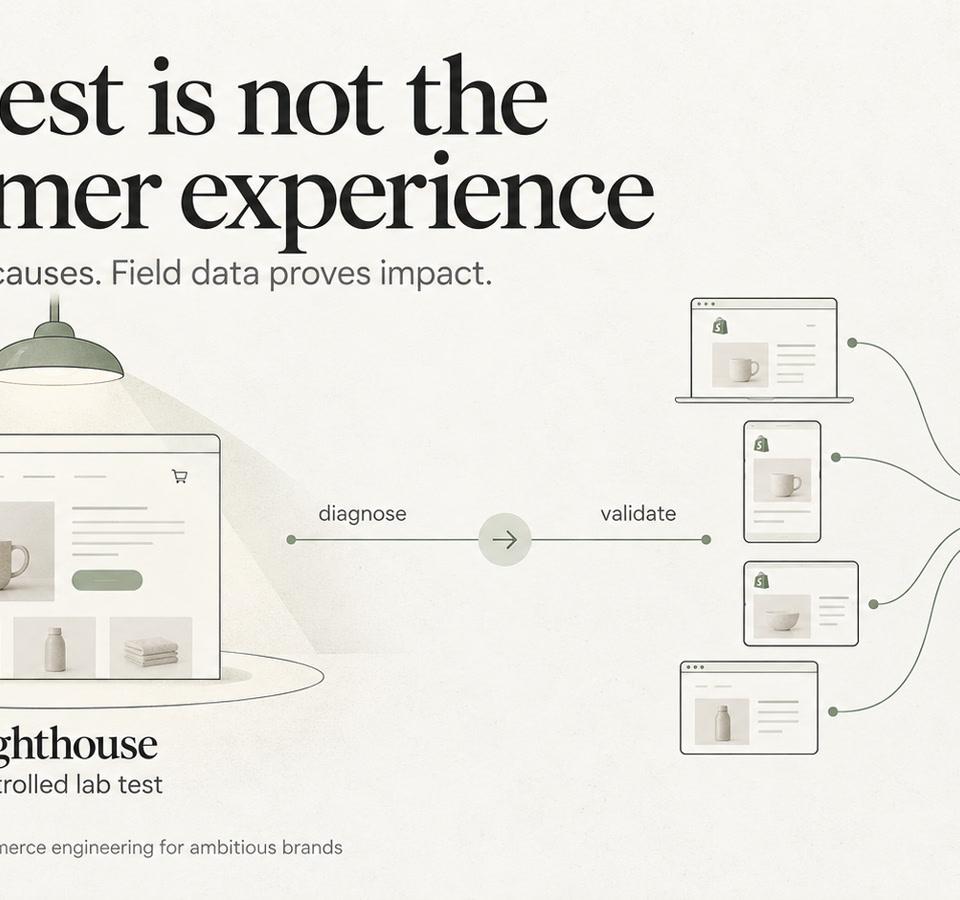
Shopify Lighthouse vs. Core Web Vitals: How to Interpret Conflicting Results
Understand why Shopify Lighthouse lab scores and real-user Core Web Vitals can disagree, and how to interpret both without confusing diagnostic scores with customer experience.