
INP on Shopify: The Event-Handler Problems Lighthouse Doesn’t Explain Well
When a Shopify storefront feels sluggish after it has loaded, the problem is often not download size but the work triggered by clicks, taps, typing and DOM updates.

Published
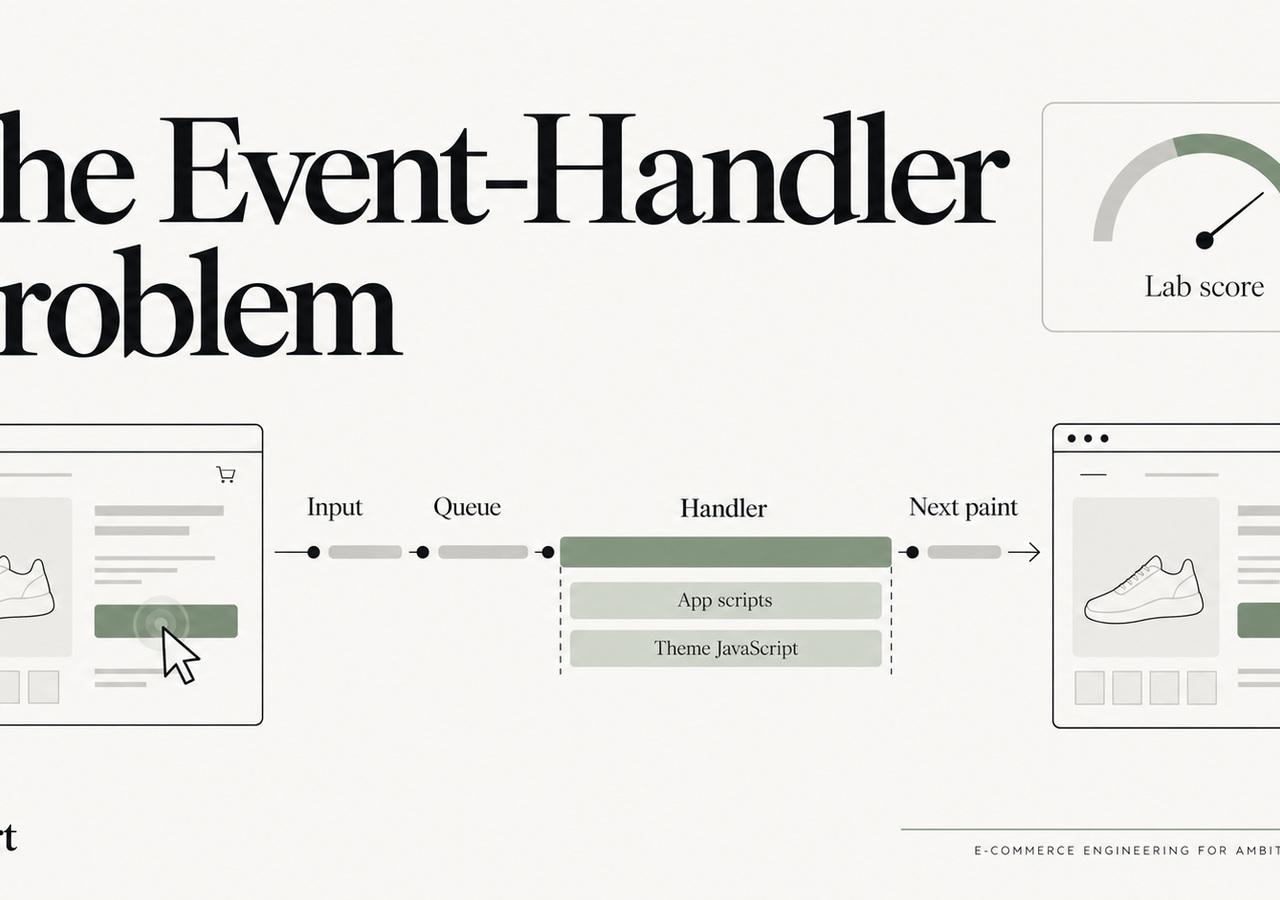
A Shopify page can load quickly and still feel slow.
That distinction matters because storefront performance conversations often stop at page load. Interaction to Next Paint (INP) asks a different question: after the customer clicks, taps or types, how long does it take before the browser can present the next visual response?
For Shopify themes, weak interaction performance often comes from event handlers doing too much work at exactly the moment the customer expects feedback.
Our Shopify Core Web Vitals guide owns the full metric and remediation topic. This field note focuses on the event-handler patterns we investigate when a storefront's interactions feel sticky.
INP is about the interaction lifecycle
web.dev's INP optimization guide breaks an interaction into input delay, processing duration and presentation delay.
That decomposition is useful because a slow click can have different causes:
- the main thread was already busy before the handler could start;
- the handler itself performed expensive synchronous work;
- the handler triggered enough style, layout or rendering work that the next frame arrived late.
Those are different engineering problems even though the user experiences all three as “I clicked and nothing happened.”
Pattern 1: one click wakes up several systems
A product-page Add to Cart action can trigger more than cart logic.
Depending on the storefront, the same event may wake up:
- analytics and attribution;
- personalization;
- cart-drawer rendering;
- subscription logic;
- upsell or recommendation widgets;
- inventory checks;
- accessibility announcements;
- custom tracking events;
- app observers watching DOM changes.
No individual handler needs to be catastrophic for the combined interaction to become slow.
When profiling, we therefore inspect the whole task sequence around the interaction instead of searching only for a function literally named addToCart.
Pattern 2: handlers do synchronous DOM work in loops
A common theme pattern reads layout, writes DOM, reads layout again, and repeats that cycle across many elements.
That can force the browser to repeatedly calculate style and layout before it can paint.
Examples include:
- measuring every swatch after each variant change;
- rebuilding a large option UI on every selection;
- scanning the entire document for components after one section changes;
- updating classes one node at a time while repeatedly reading dimensions.
The exact fix depends on the component, but the principles are consistent: scope the work, batch reads and writes, and avoid rebuilding parts of the DOM that did not change.
Pattern 3: global listeners solve local problems
Themes and apps often attach listeners at the document or window level because it is convenient.
Event delegation can be efficient, but global handlers become expensive when every click or input runs broad selector matching, data parsing or state synchronization unrelated to the element the customer actually used.
We check:
- what events are registered globally;
- whether multiple modules listen for the same interaction;
- how much work each listener performs before exiting;
- whether listeners are accidentally registered more than once during section reloads or app initialization.
Duplicate listener registration is especially easy to miss because the interface can remain functionally correct while doing the same work two or three times.
Pattern 4: long tasks block the next interaction before it starts
Sometimes the click handler is fine. The customer simply clicked while the browser was busy running something else.
web.dev's explanation of script evaluation and long tasks is useful here. A long main-thread task can delay input before the relevant event handler even begins.
On Shopify, post-load work can include analytics initialization, recommendation rendering, review widgets, consent tooling, experimentation frameworks and app code that schedules large chunks of work shortly after first paint.
This is why “the button handler took 20 ms” does not prove that the interaction was fast. The input may have waited hundreds of milliseconds for the thread to become available.
Pattern 5: JavaScript renders an entire component for a tiny state change
A customer selects one variant. The storefront replaces a large section of HTML.
A customer changes quantity. Multiple widgets recalculate and re-render.
A customer opens the cart drawer. The implementation rebuilds more UI than is visible.
These patterns can be perfectly functional and still produce expensive interaction work.
We prefer to update the smallest state and DOM surface that actually changed. Shopify themes do not need to imitate the rendering model of a large single-page application for every interaction.
That connects directly to our Liquid vs. JavaScript architecture field note: render a useful initial state in Liquid, then make client-side updates as targeted as possible.
Pattern 6: observers create feedback loops
MutationObserver can be useful when integrating systems that do not share an event model. It can also create hard-to-see performance loops.
One script changes the DOM. An observer reacts. Its reaction changes the DOM again. Another integration reacts to that change. The work can repeat while the customer waits for the interface to settle.
When we see unexplained interaction cost, we inspect observers and app integrations around the affected DOM subtree—not just click handlers.
How we debug a weak interaction
We start from a real user action rather than from a generic performance report.
Typical sequence:
- Choose a repeatable interaction: variant selection, menu open, filter, search input, cart action.
- Record a browser performance trace.
- Find the interaction and its input delay.
- Expand the event-processing tasks.
- Identify script origins and functions consuming time.
- Look for forced style/layout and large render work.
- Check what else was occupying the main thread immediately before the event.
- Reproduce with suspected integrations disabled in a non-live theme.
- Measure again after the smallest targeted change.
This is much more actionable than trying to “optimize INP” globally without a representative interaction.
Shopify-specific guardrails
Shopify's theme performance guidance recommends minimizing JavaScript, avoiding unnecessary libraries, using platform/browser features where possible and rendering essential content in HTML/Liquid.
Those recommendations help INP because every unnecessary client-side dependency is another possible source of main-thread work or event coordination.
The goal is not zero JavaScript. It is less JavaScript competing with customer interactions and less work inside the handlers that remain.
A useful success criterion
We do not consider an interaction fixed because a synthetic report turned green once.
We want:
- the targeted interaction to respond promptly under representative conditions;
- no functional regression;
- no new layout instability;
- no broken analytics or app behavior;
- field data to move in the expected direction once enough real-user observations accumulate.
Performance engineering is strongest when the optimization is tied to a customer action and a measurable browser bottleneck.
For the full storefront framework, see our Shopify Core Web Vitals guide. If third-party code is involved, the companion field note Shopify Store Slower After Installing Apps? covers the isolation process.
Keep exploring this topic
Deeper references from the Shugert library and the service that turns this work into a fixed scope.
Related resources
- PerformanceMoving Core Web Vitals on Shopify: LCP, INP & CLS in 2026What actually moves LCP, INP and CLS on a real Shopify store. For the broader speed framework, see our Shopify Performance Optimization Guide.
- ShopifyShopify Performance Checklist for $500k+ DTC Brands (Field-Tested)A field-tested audit checklist for established Shopify stores. For the full framework, start with our Shopify Performance Optimization Guide, this checklist is the tactical companion.
- PerformanceShopify App Bloat: How Too Many Apps Kill Store PerformanceEvery Shopify app taxes every page load. How to audit your stack, cut the bloat costing you the most LCP and INP, and stop the pattern from repeating.
Related services
Keep reading
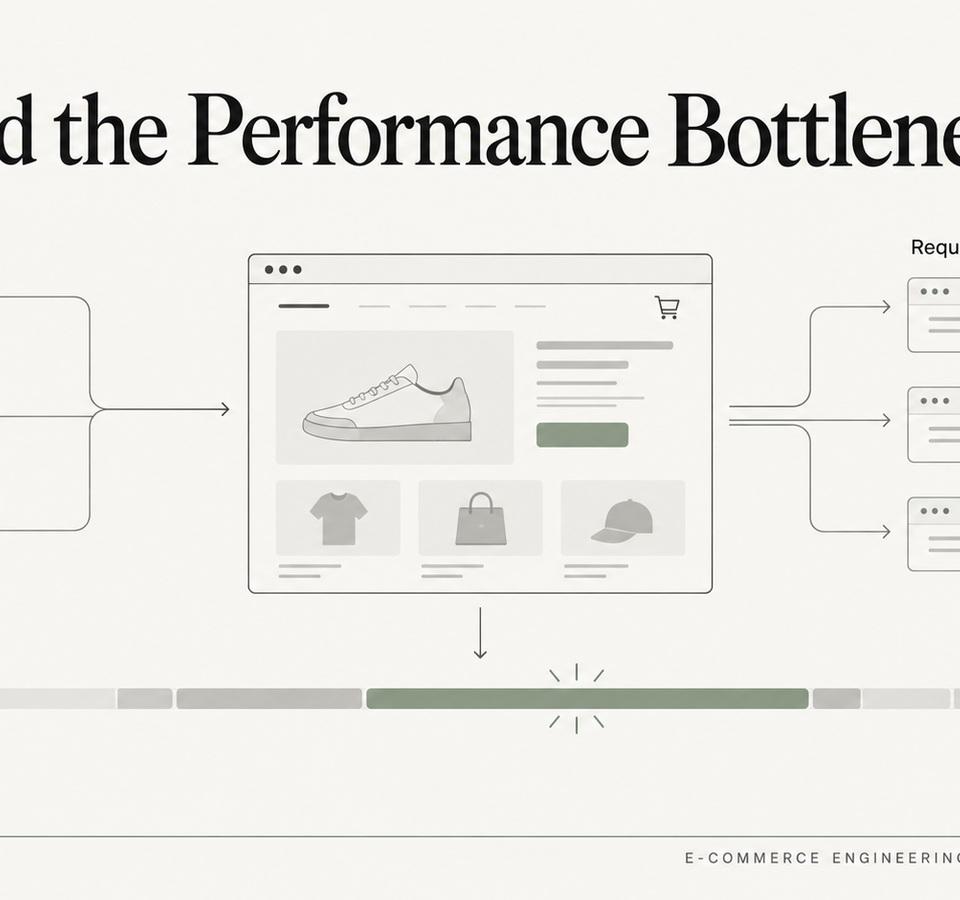
Shopify Store Slower After Installing Apps? How We Isolate the Real Bottleneck
Apps are often blamed for Shopify performance regressions, but the useful question is which network, main-thread, DOM or rendering cost actually changed.
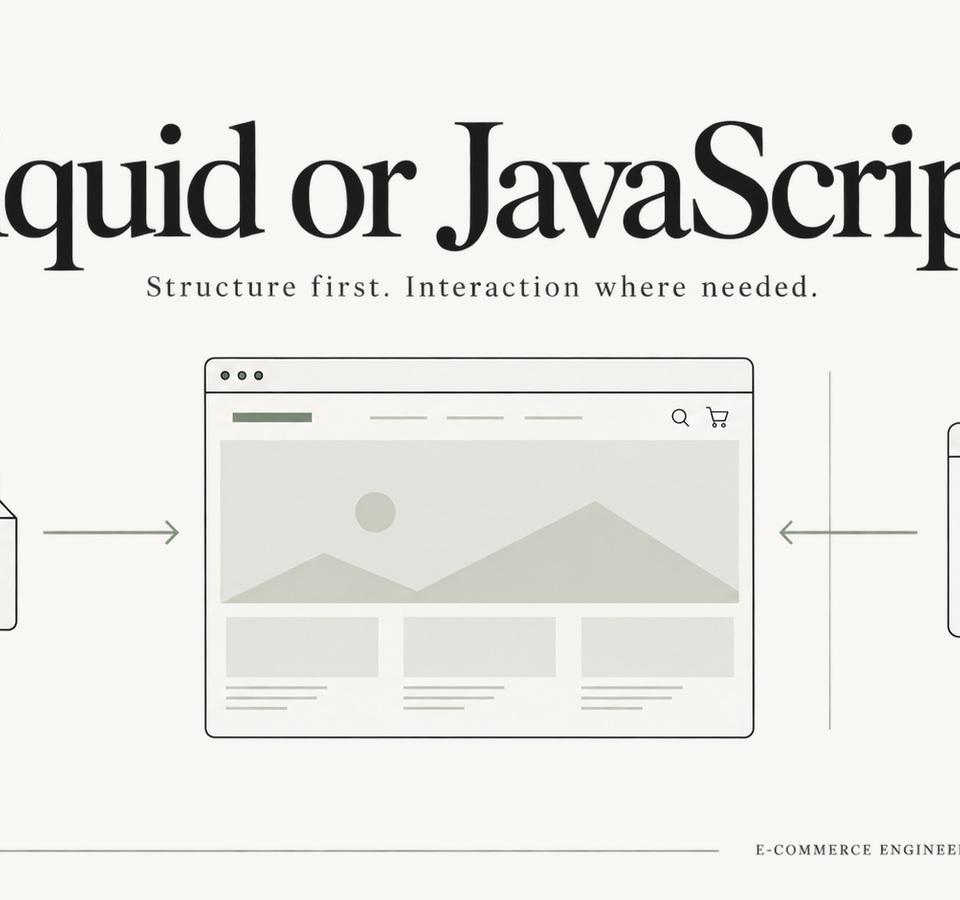
Shopify Theme Architecture in 2026: When Liquid Should Win Over JavaScript
JavaScript is essential for interaction, but many Shopify themes ask it to do work that Liquid and HTML can deliver earlier, more reliably and with less main-thread cost.
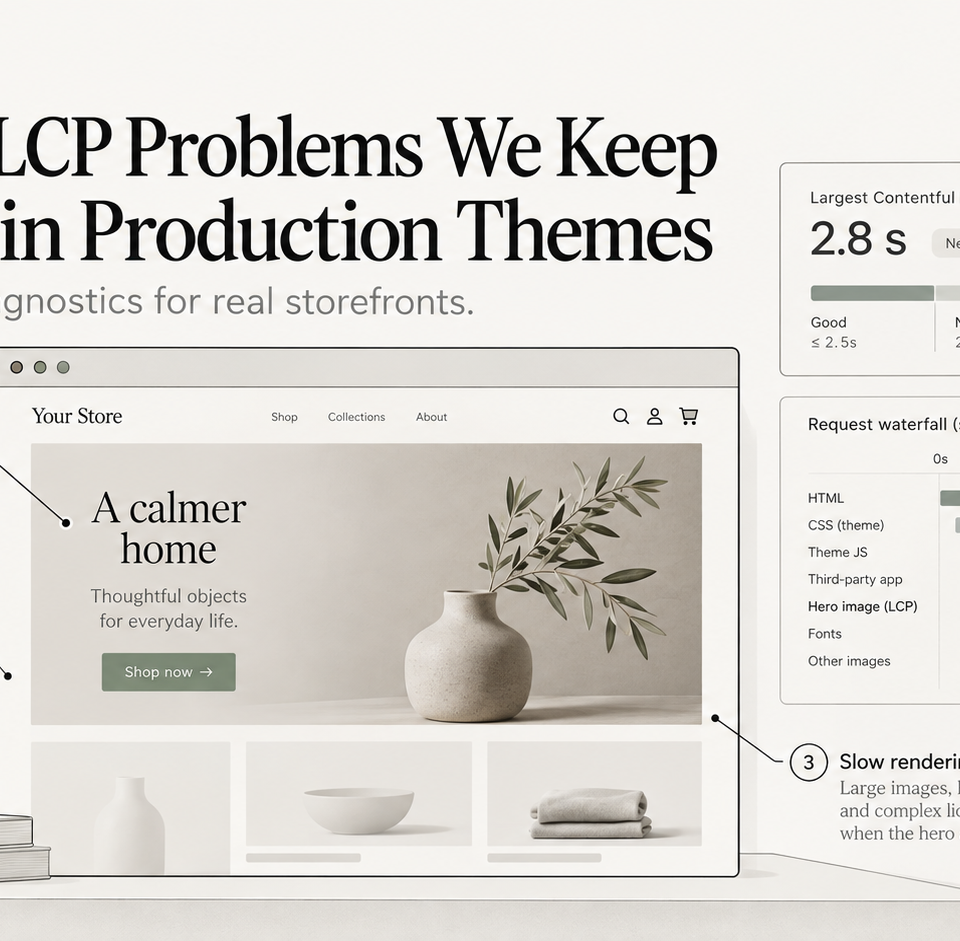
Shopify LCP Problems We Keep Finding in Production Themes
Why Shopify hero images, animations, JavaScript rendering and third-party code repeatedly turn into LCP problems—and what we check first.